Charts
<chart> plots one or more data series as line, area, bar, pie, scatter, or candlestick. macOS
renders through Swift Charts in an NSHostingView, the framework GNOME apps use for charting.
GTK has no equivalent library, so the GTK backend draws the same six types itself onto a
GtkDrawingArea with Cairo.
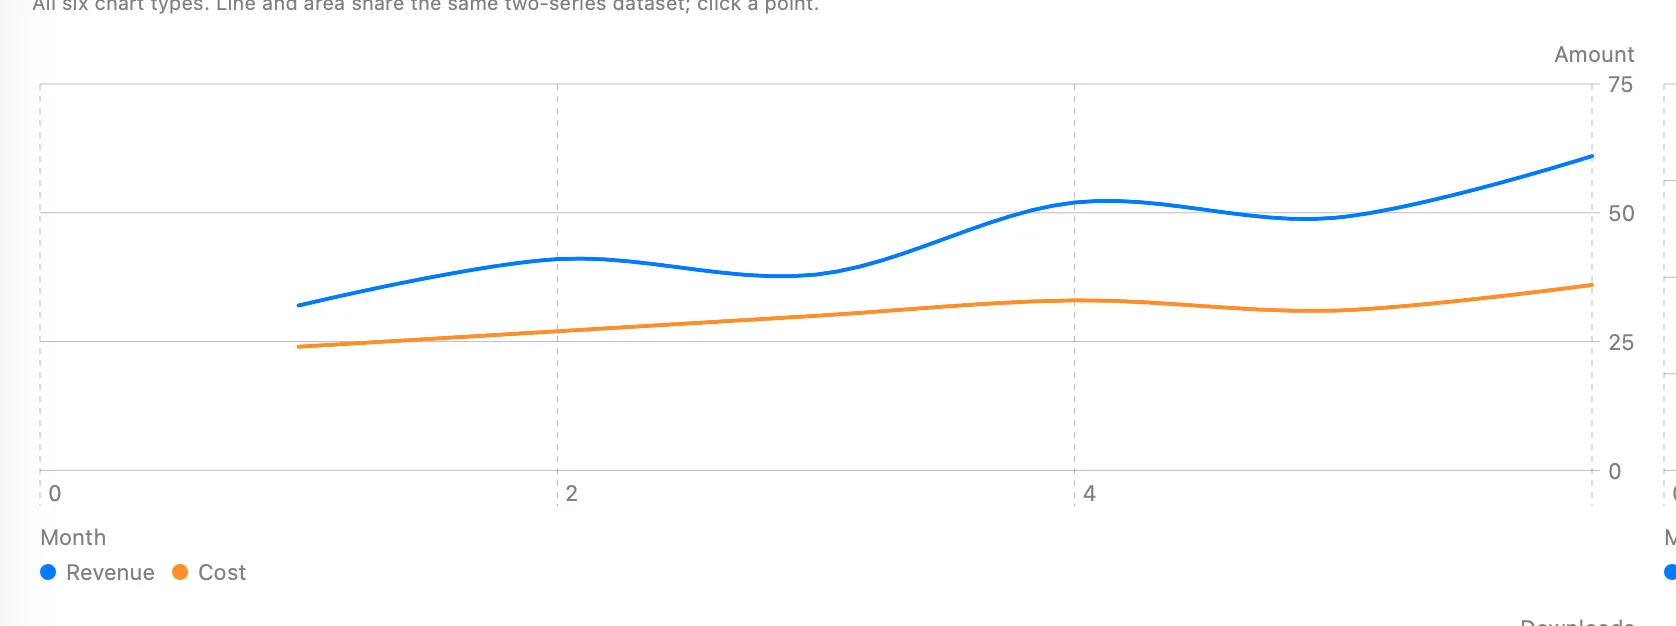
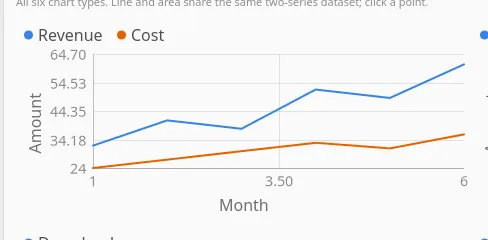
const trend = [  { id: "revenue", label: "Revenue", points: [    { x: 1, y: 32 }, { x: 2, y: 41 }, { x: 3, y: 38 }, { x: 4, y: 52 },  ] },  { id: "cost", label: "Cost", points: [    { x: 1, y: 24 }, { x: 2, y: 27 }, { x: 3, y: 30 }, { x: 4, y: 33 },  ] },];
<chart  type="line"  series={trend}  xLabel="Month"  yLabel="Amount"  onPointSelected={(e) => {    const { seriesId, index, x, y } = e.data as { seriesId: string; index: number; x: number; y: number };    console.log(`${seriesId} point ${index}: (${x}, ${y})`);  }}/>;
Data shape
Section titled “Data shape”interface ChartPoint { x: number; y: number; label?: string; open?: number; high?: number; low?: number; close?: number;}
interface ChartSeries { id: string; label: string; color?: string; points: ChartPoint[];}x/y are the numeric axes. label names the point on a category axis (bar’s tick labels) and
names the slice on a pie. open/high/low/close carry a candlestick’s body and wick and are
ignored by every other chart type, which read y instead.
id is echoed back in pointSelected. label is the legend entry. color is an explicit
#rrggbb; leave it unset and the series takes the next slot of the platform’s accent-seeded
palette. The widget never sorts, filters, or rewrites points. The app owns the data, the same
contract as <table>’s rows.
ChartSeries and ChartPoint are re-exported from @nativedesktop/react, so import them
directly rather than relying on structural typing:
import type { ChartPoint, ChartSeries } from "@nativedesktop/react";| Prop | Type | Applied | Notes |
|---|---|---|---|
type |
"line" | "area" | "bar" | "pie" | "scatter" | "candlestick" |
createAndUpdate | Default "line". |
series |
ChartSeries[] |
createAndUpdate | No default. An empty array renders an empty plot. |
xLabel |
string | createAndUpdate | Axis title. Default "" (no label). Unused by pie. |
yLabel |
string | createAndUpdate | Axis title. Default "" (no label). Unused by pie. |
showLegend |
bool | createAndUpdate | Default true. |
showGrid |
bool | createAndUpdate | Default true. Unused by pie, which has no axes to grid. |
animated |
bool | createAndUpdate | Default true. The OS reduce-motion setting outranks this prop, the same rule <skeleton> follows. |
Events
Section titled “Events”| Event | Handler | Payload |
|---|---|---|
pointSelected |
onPointSelected |
{ data: { seriesId, seriesIndex, index, x, y } } |
Fires when the user clicks or taps the nearest point, within a small hit radius (24px on both
backends). A candlestick point hit-tests against its close price rather than y on both
backends.
Chart types
Section titled “Chart types”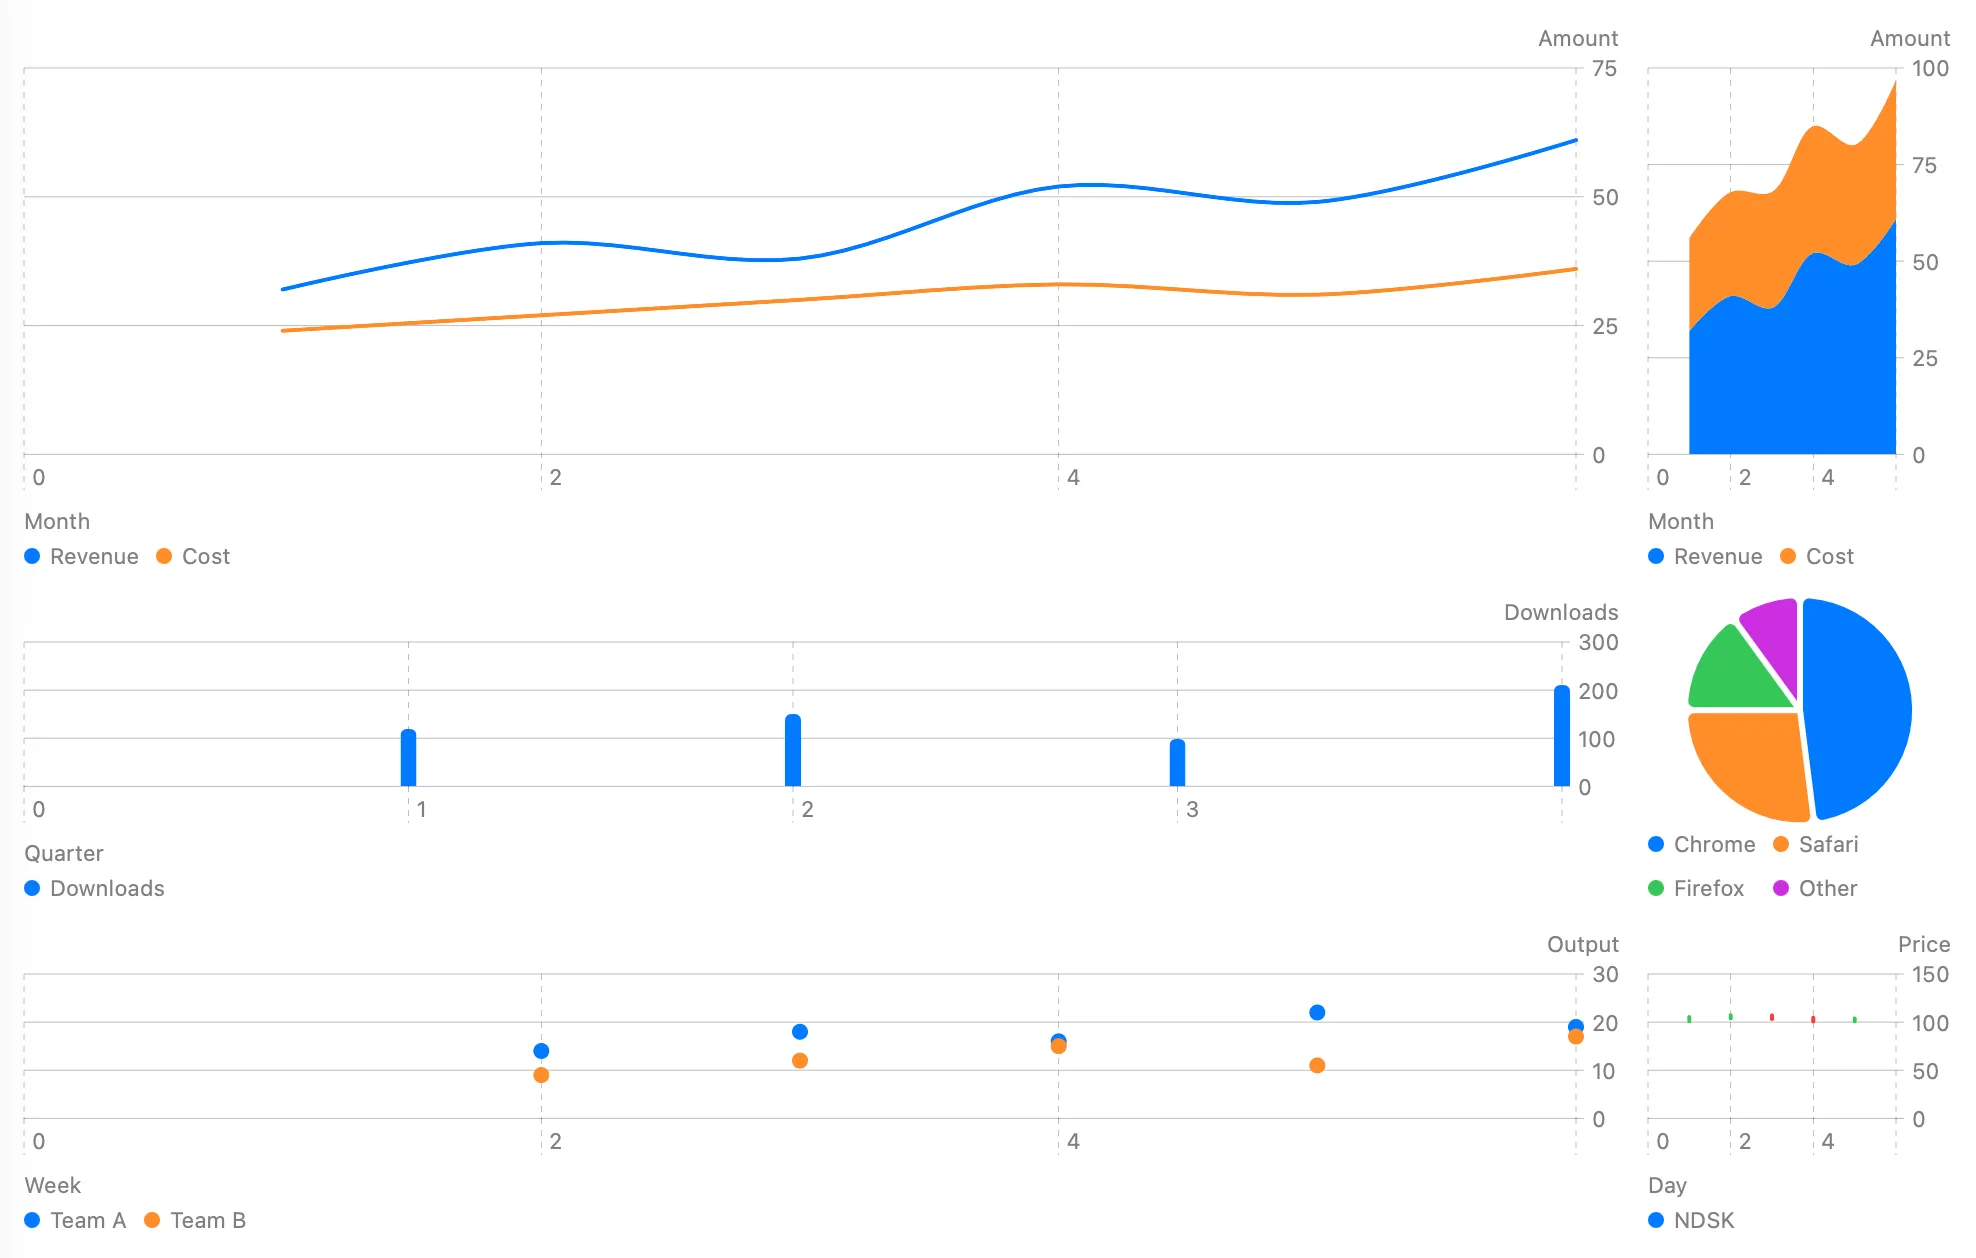
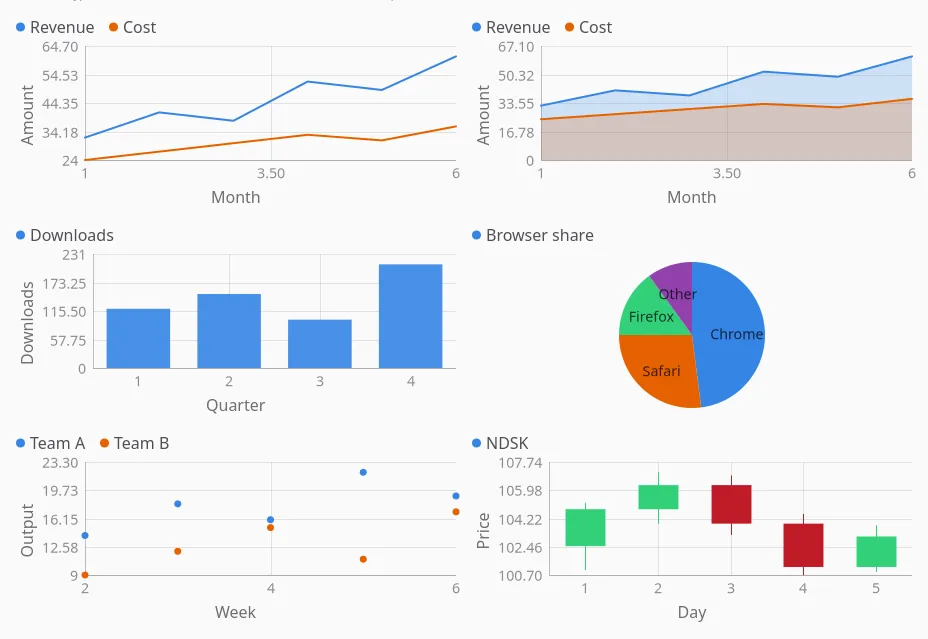
- line – one connected line per series, drawn with a smooth (Catmull-Rom) interpolation.
- area – the same line, filled down to the axis.
- bar – grouped bars per series, one band per point. Bars are centred in their own band rather
than on their
xvalue, so the first and last bar sit fully inside the axes. - pie – reads only
series[0]. Each point becomes one slice:labelnames it,abs(y)sizes it. A second series would be a second angular scale on the same plot, which isn’t a pie, so it’s ignored. - scatter – unconnected points per series, no line between them.
- candlestick – reads
open/high/low/closeper point: a wick spanslow…high, a body spansopen…close. The body/wick colour is the series’colorif set, otherwise the system green/red up/down convention (green whenclose >= open).
Platform notes
Section titled “Platform notes”- Colour. Series slot 0 takes the live system accent color; the rest walk a fixed system-colour
ramp (orange, green, purple, yellow, red, brown on macOS). A series’ explicit
coloroverrides its slot. Candlesticks ignore the ramp and use the up/down convention unlesscoloris set. - Theme. Both backends read colours at draw/render time rather than caching them, so an accent or light/dark switch repaints every live chart without an app re-render.
- macOS. Swift Charts owns axes, ticks, and legend placement; the widget only hands it the
parsed series. Point selection is a zero-distance
DragGestureover the plot area, the standard Swift Charts tap-to-select pattern, matched against the nearest point’s screen position. - GTK. The widget draws everything itself: axes, gridlines, marks, and the legend, since GTK
ships no charting library.
animatedgrows each series’ geometry from a zero baseline on every data change; anotifyhandler on the sharedAdwStyleManagerrepaints every live chart on an accent or light/dark change.
See examples/parity/main.tsx’s Charts section: all six types on their own datasets, plus a
“Live” tab that switches type on one shared dataset while toggling showLegend, showGrid, and
animated. The Live tab has no screenshot here: switching to it needs a TabView setValue arm
neither backend’s semantic-action dispatch implements yet.